Non-specialist Starter
Learning about stars is fun! It is also usually a great deal of work. I look at stellar spectra, i.e., starlight spread out into its colors, and from the fine details it contains, deduce how hot a star is, how large it is, if it is pulsating, how fast it is spinning or rotating, what sort of motions exist in the outer layers of the star (called the photosphere), how these motions vary with depth in the photosphere, if there are spots on the star’s surface, how fast the star is moving in space, and so on.
So how do we get a star’s spectrum? First we need a telescope pointed at the star of interest to collect the star’s light. The light is brought to a focus by the mirrors or lenses of the telescope and we call the bright spot the ‘image’ of the star. In truth, the stars are too far away to actually image their surfaces. The only exception is ‘our’ star, the Sun. The Sun spans about half a degree in the sky and we can see all sorts of details on the solar surface. Stellar astronomers, like me, often use information from the Sun as an ‘idea bin’ or a guide to what might be happening on the surfaces of other stars. Meanwhile, back to our starlight... We guide the light collected and focused by the telescope into a spectrograph; that’s our machine for spreading out the starlight into its rainbow colors. Here is a rough concept of a spectrograph:
For our purposes, the ‘hole’ on the left corresponds to the starlight focused by the telescope. The glass prism is the device that actually disperses the light. The ‘white card’ in our case is replaced by a light detector, mainly charge-coupled devices, alias CCDs, that convert the light to electrical signals; more light stronger signal, much like a normal hand-held camera.
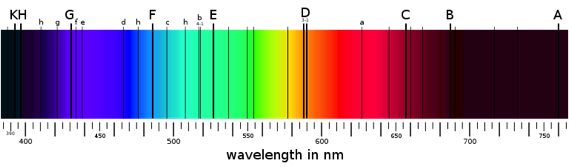
If you’ve ever played with a prism or enjoyed a ‘suncatcher,’ you know that the spectrum easily fits into the palm of your hand. But in the coudé spectrograph at the Elginfield Observatory, the spectrum is spread out much more, over several meters, in fact. This is accomplished by using a diffraction grating instead of a prism. The motivation here is to spread out the light so we can see and measure small features in the light. The features I’m talking about are called spectral lines (Fraunhofer Lines). Here is an example taken from Wikipedia:
The deep violet side on the left corresponds to a wavelength of about 3500 Ångstroms (1010 Å in one meter) and it ranges to the deep red on the right at about 7500 Å, or roughly a span of 4000 Å. You can see the dark vertical lines in the spectrum above. They are very narrow color bands in which there is less light, so they look dark. The light in the lines has been absorbed by the gasses of the star’s atmosphere, so they are called ‘absorption’ lines. There are lots of lines in stellar spectra and they have different amounts of light missing or darkness. Instead of looking at a pretty colored picture like the one above, we usually use graphs. Here is a graph of two of those narrow dark lines:
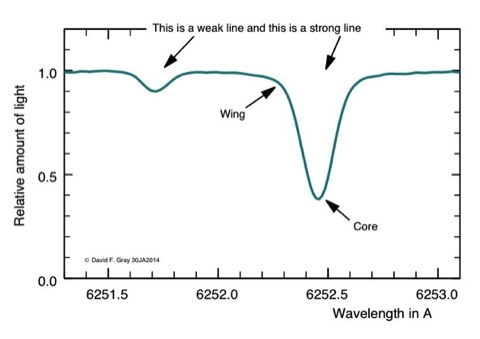
The maximum amount of light is set at 1.0 (lefthand scale) and no light is set at 0.0. The weak line has only a little light missing, while the strong line has a lot more missing. The missing light has been absorbed by the atoms in the outer layers of the star. The weak line on the left is caused by vanadium gas, while the strong one on the right is caused by iron gas. (Yes indeed, stars are so hot that even metals are vaporized.) The deepest part is called the core, the shallow parts are called wings. Places where there is no line absorption are called the continuum.
Notice the wavelength scale on the lower axis. The span here is less than two Ångstroms; compare that to the 4000 Å span of the full visible spectrum shown above. Spectral lines are narrow! And yet they convey enormous amounts of information: the relative central depth of the vanadium line to the iron lines is a stellar thermometer; once the temperature is known, the amount of vanadium and iron can be deduced from the amount of light absorbed by each line; the shapes of the lines, called their ‘profiles,’ tell us about how rapidly the star is rotating (yes, spinning like a big top) and about the motions of the gases comprising the outer layers of the star from which the light emanates. The positions of the lines relative to each other tell us about the rising flow of material in these outer layers. The collective wavelength shift of the spectral lines compared to laboratory measurements of the same lines gives us the line-of-sight component of the space motion of the star, called the radial velocity.
So there you have it. You will find other examples of stellar spectra and line profiles on my other web pages along with information on how they are used.
Hole
White Card