Stellar Granulation
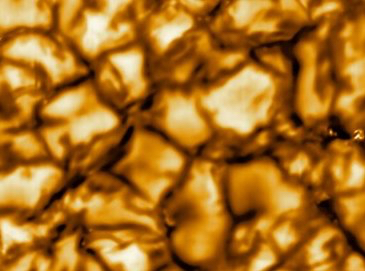
Granulation is the top of the convection zone that comprises the outer portion of stars on the cool half of the HR diagram. Its name comes from the granular appearance of the solar surface seen in normal visible light, and that in turn stems from the difference in temperature between the hotter rising material (granules) and the cooler falling material (inter-granular lanes). It is often referred to as the ‘overshoot’ region since the material in the granulation is driven upward from the buoyancy of hot material in deeper layers and is coasting and slowing down with height. On the Sun, the granules have a characteristic dimension of a megameter and are about 20% brighter than the falling gas. Solar granules take a few minutes to rise and disperse. Here is a sample a a small portion of the solar surface:
Bright regions, the granules, are rising hotter gas. Dark lanes are falling cooler gas. The larger granules are about 1000 km across. Extracted from a larger image from the Daniel K. Inouye Solar Telescope.
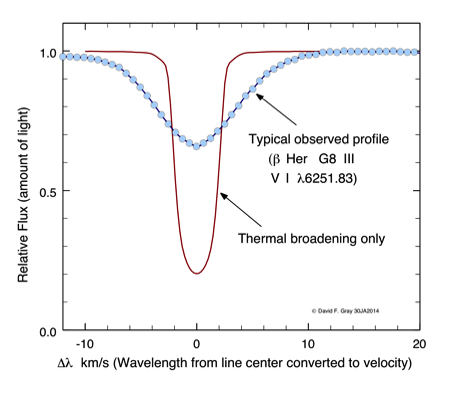
Here is an example of a theoretical profile with only thermal broadening compared to a profile for a real star. (Based on Figure 17.1 of Photospheres.)
For other stars, we rely on analysis of the star’s spectral lines to detect granulation. We see three ‘signatures’ of stellar granulation:
1) The 1st signature: spectral lines are broadened by the Doppler shifts of the granulation. In most stars, the granulation velocities and their Doppler shifts dominate those from other photospheric motions, such as non-radial oscillations or thermal motions. Traditionally, this component of line broadening is called ‘macroturbulence.’ Doppler shifts of rotation can be a competitor in broadening lines, and disentangling rotational broadening from macroturbulence broadening can be a challenge, but Fourier analysis goes a long way in accomplishing it.
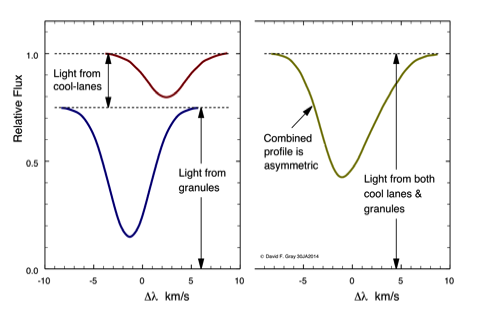
2) The 2nd signature is asymmetry, introduced into the profiles of spectral lines by the granulation. The reason is simple: the granules on stellar surface are rising and produce blueward Doppler shifts, while the inter-granular lanes are moving downward and produce redward Doppler shifts. The granules give more light than the lanes so the combined distribution of Doppler shifts is asymmetric and that distribution is impressed on all photospheric spectral lines. Here is a conceptual diagram of the process:
The conventional observational tool for measuring asymmetries is the line bisector, constructed by connecting the midpoints of horizontal line segments across the spectral line at a set of depths, like this:
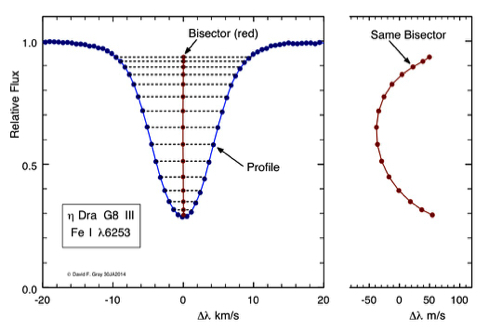
On the left, the bisector is shown on the same velocity scale as the profile. It looks almost like a straight vertical line. The shape of the bisector can be seen more clearly on the right, where the velocity scale has been expanded 100 times. (Based on Figure 17.11 of Photospheres.)
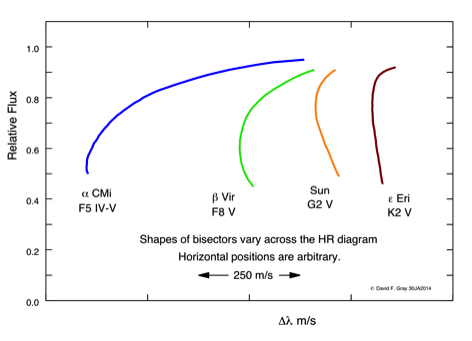
The ‘C’ like shape of the bisector is typical of many stars on the cool half of the HR diagram, but reversed C-like shapes also exist, mostly on the hot side of the so-called Granulation Boundary. Explanation of the physical meaning of the bisector shapes in terms of the contrast between granules and lanes can be found in the 2009 ApJ 710, 1003. Explanation of how bisectors in hotter stars show a reversed C shape can be read in another paper in the 2010 ApJ 721, 670.
Hottest of the four stars is on the left; coolest on the right. Additional shapes can be seen in 2005 PASP 117, 711.
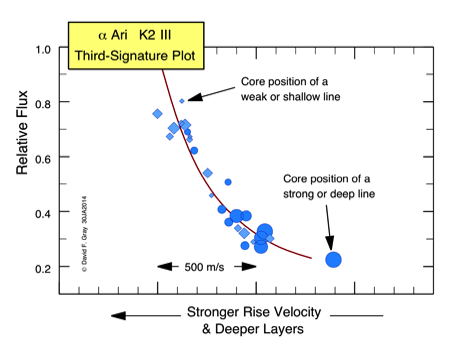
3) The 3rd signature: cores of weaker spectral lines are formed deeper down in the stellar photosphere compared to the cores of stronger lines. The Doppler shifts of the line cores reflects the rise velocities of the granulation where they are formed. (Remember the light from the granules dominate and they are rising.) In the photosphere, the convective overshoot region, the velocities are decreasing with height. In summary, cores of weak lines = deep layers = faster rise velocities; cores of strong lines = high layers = slower rise velocities.
Here is an example of what we see.
Bright giant, like α Hya, and supergiant stars, like γ Cyg or Betelgeuse, also show variations in their radial velocity that are attributed to large convection cells.
References to some of my papers on granulation and related topics can be found on a separate page.