Fourier Analysis
We often investigate the shapes of spectral lines using their Fourier transforms. Much more information is given in my book Photospheres, with a primer on Fourier transforms in Chapter 2. We take the transform of the spectral line expressed in line depth downward from the continuum. In this way, the wings of the lines are at zero and the maximum occurs at the core of the line. When we plot the transforms, we ususally use logarithmic coordinates and plot only the positive frequency half, since the transform is assumed to be symmetric. The wavelength scale is expressed in velocity units, km/s, by using v = Dm c/m, where Dm is measured from the center of the line. The Fourier frequency coordinate is then in s/km.
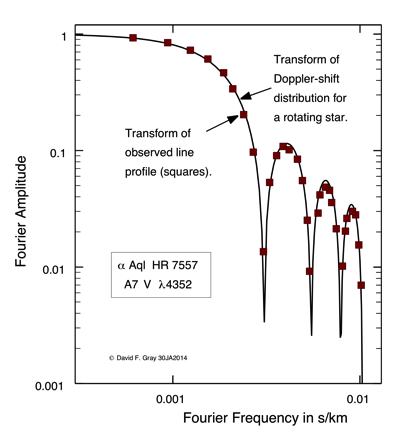
Here is an example of the Fourier transform of a line showing strong rotational broadening.
Squares show the transform of the observed line profile. The solid line shows the transform of the theoretical shape for a rotation rate of 209 km/s.
Fourier analysis is particularly powerful in separating rotational broadening from macroturbulence broadening. Please see Chapters 17 and 18 in Photospheres for more details.