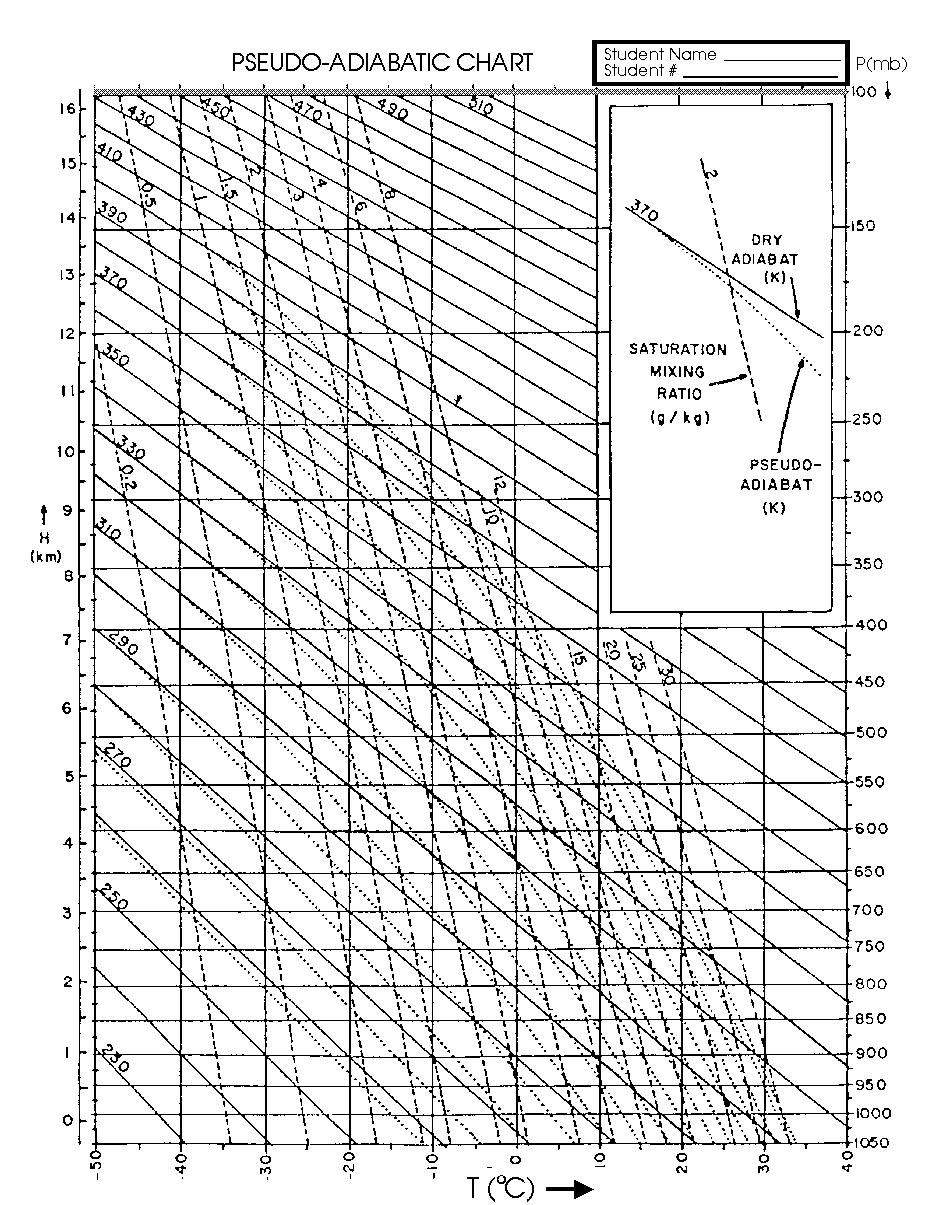
The following diagram shows an ADIABATIC CHART. You should understand how to apply such charts in simple situations. See your text book, page 174-175, for a description of application of such charts. Note that the text book uses different colours for the different lines, but the chart below does not - if you are asked to use a chart in an exam, it will be a black and white one like this one.

Copyright W.K. Hocking, 2000.
Last updated 15 November, 2000