Solutions, ASSIGNMENT 2 - Chapters 8-11 ........... Assigned 23 Jan 2003 ............Due date was Thurs 13 Feb 2003.
Marks assignment: Question 1 = 8 marks, question 2 = 8 marks, question 3 = 10 marks, question 4 = 10 marks, question 5 = 10 marks, question 6 = 8 marks. Total = 54.
1. The picture below shows a thick, low, stratified cloud which is producing precipitation over a broad area.
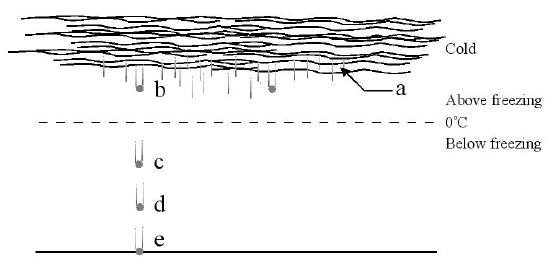
(a) What is the name of this cloud?
Answer: Nimbostratus
(b) At the letter "b" in the diagram, a cold raindrop is falling towards the surface in above-freezing air. If the raindrop initially formed in the cold upper part of the cloud as a snowflake, by what process of rain formation was the the precipitation probably formed?Answer: ice-crystal (Bergeron)
(c) The droplet of water at the point labelled "c" exists in below-freezing conditions, yet remains a liquid. What special name do we give to the condition of this particle ? Why does the droplet not instantly freeze?Answer: Supercooled
Discussion
For an ice crystal to freeze, enough molecules must "join together" in a crystalline structure so that they form a nucleus for other molecules to build on. However, thermal motions within the droplet quickly destroy this structure. So freezing does not readily occur. Freezing can occur if the dropet finds a suitable surface to form around (eg. Special ice nuclei such as kaolinite) but these are rare. Only at temperatures below -40oC does spontaneous freezing occur regularly. (text, p.186)
Answer: Sleet (ice pellets)
(e) If, rather than freezing at "d", the droplet does not freeze until it reaches the ground, what form of precipitation will now result? Briefly describe one recent event in which this type of precipitation caused catastrophic damage.
Answer: Freezing rain.
Discussion
One recent event involving freezing rain was the ice storm in Quebec in January 1998 (and the surrounding regions, including New England and eastern Ontario.) The weight of the ice which accumulated on trees and other structures caused enormous damage. Forests were destroyed, power lines were brought down (causing large-scale blackouts). The damage was estimated at over $1 billion (See textbook, p. 197-198)
2. The cloud shown below is deep, anvil-shaped at the top, and has rain falling from it.
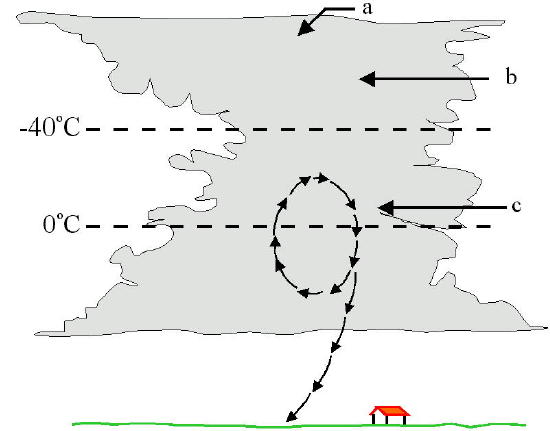
Figure for question 2.
(a) What sort of cloud is it?
Answer: Cumulonimbus
(b) What sort of water/ice particles would you be most likely to detect in the regions denoted by the letters "a" and "b" in the figure?Answer: Ice crystals, ice particles.
(c) What sort of particles are most likely to occur in the region "c"?Answer: Mostly liquid cloud droplets (supercooled) - some ice, but dominantly water.
(d) Suppose a precipitation particle makes several journeys up and down in the region designated as "c", as shown by the loop of arrows. Write a few sentences describing what the particles would eventually look like when they finally fall out and reach the ground? What would they be called? When the particles finally fall to the ground they would be in the form of hard, rounded pellets or irregular lumps of ice. When cut in half they often reveal nearly concentrated shells of differing densities and degrees of opaqueness. These particles are called Hailstones. Hail begins as small ice pellets that grow by adding super-cooled water droplets as they move through the cloud (accretion). Strong updrafts may carry stones upwards in several cycles, so that the stone increases in size by adding a new layer every cycle. Eventually the hailstones encounter a downdraft or become too dense to be supported by the updraft, and so fall out to produce a hailstorm.3. The figure below represents summer, daytime (after noon) conditions along the coast of a large body of water in the Northern Hemisphere. Print the figure, and then answer the following questions.
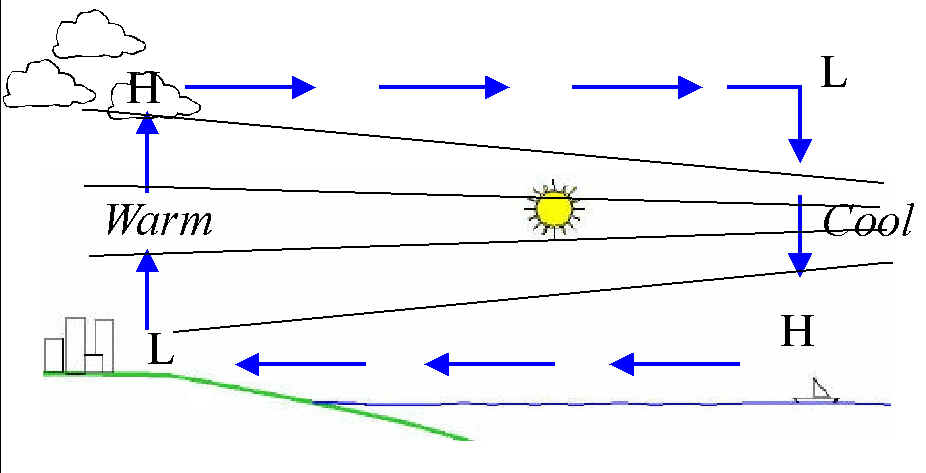
(a) On the diagram, label where the surface air is relatively warm and where it is relatively
cool.
(b) Place a letter "H" on the diagram where the surface air pressure would be relatively
high, and an "L" where the surface air pressure would be relatively low.
(c) Draw several arrows to show the direction of the surface wind.
Answer: See the diagram above for parts a, b and c.
(d)What is the name of this breeze?Answer: Sea Breeze
(e) Draw several more arrows to complete the circulation.See the figure for parts e and f. The cloud appears here because the air is rising and therefore cooling at this location.
4. The figure below shows a surface weather map in the Northern Hemisphere. Numbers on the contours refer to pressures in hPa. Answer the following questions.
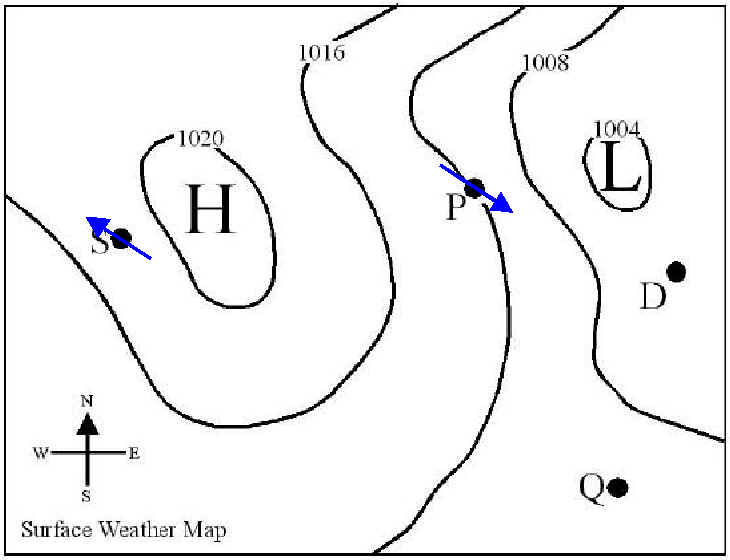
(a) What is the sea-level pressure at the point "P"? If the station at "P" at which
these recordings were made was 250 metres above sea-level, what would have been the approximate
actual pressure at the station at the time?
Answer: The point "P" is on the 1012 hPa contour. Therefore sea-level pressure at P = 1012 hpa True pressure: pressure drops by 10mb for each 100m. Hence there is a 25 hPa drop, so that the true pressure = 987 hPa
(b) From what direction would the wind most likely be blowing at the point P? (Be sure to consider both frictional and Coriolis forces in your considerations.) Explain why you made the choice that you did.Answer: The wind will blow from the North-West, as shown. If there were no friction, the geostrophic balance between the Corriolis force and the pressure gradient force would result in flow along the isobars, but friction means this is not quite true. Hence the wind will try to flow along the isobars, but will be tilted slightly from high to low pressure.
(c) Would the pressure-gradient force at point "P" be directed towards the "H", towards the "L", towards the point "D" or towards the point "Q"?Answer: The pressure gradient force will be directed to the L pressure, by definition
(d) Would the wind at point S be most likely to be blowing from the southeast, southwest, northeast or northwest? Explain.Answer: It would blow from the southeast, To see this, recognize that without a Coriolis force, it would blow away from the H. But then the Coriolis force would deflect it to the right, parallel to the isobars. Hence it would flow from the southeast. Friction would cause it to orientate itself so it is not quite parallel to the isobars, but is blowing slightly away from H. Hence the direction is as shown in the figure.
(e) Would you expect the strongest winds at point "P", "D" or "Q"? Why?Answer: The strongest winds will be at P because the isobars are closest together here
5. The figure below shows an upper level weather map in the Northern Hemisphere. Numbers on the graph represent pressures in hPa. Print the graph and answer the following questions.

(a) Determine the approximate height at which this map applies.
Answer: Use appendix H. A pressure of around 460-480 hPa applies at an approximate height of 6000 metres.
(b) Draw at least 10 arrows on the chart indicating direction of wind flow at different points.Answer: see the map above.
(c) Indicate the regions where you would expect the winds to be (i) strongest, (ii) weakest, and (iii) most easterly.Answer: See map. S = strongest winds, W = weakest winds (several points), and E = most easterly winds.
(d) Determine the strength of the wind at the point where it is strongest. You will need to make use of the scalings and other information shown on the graph. [Hint: see the section entitled "A mathematical look at the geostrophic wind", page 226 of the text book (sixth edition)].Answer: You need to use the equation
6. Multiple choice questions.
The correction solutions are indicated in bold below
(i) The horse latitudes are the result of:
a) the polar front jet stream(ii) In terms of the three-cell model of the general circulation, areas of surface low pressure should be found near:
a) the equator and 60o latitude(iii) A jet maximum or jet streak is:
a) a contrail that forms behind a jet aircraft(iv) At the equator according to the three-cell general circulation model, we would not expect to find:
a) heavy showers(v) The three-cell model of the general circulation says that in the Northern Hemisphere, you would expect to observe the surface westerlies:
a) southward of the ITCZ(vi) According to the three-cell general circulation model, one would expect the driest regions of the world to be near:
a) latitude 30o and 60o(vii) Which of the following does not occur during a major El Nino event?
a) extensive ocean warming occurs over the tropical Pacific Ocean (viii) An air parcel moving northward from the equator moves closer to the earth's axis of rotation.
Because of the conservation of angular momentum, the parcel's speed should:
------------------- END -------------------------