ASSIGNMENT 2 - Chapters 8-11 ........... Assigned 23 Jan 2003 ............Due date: Thurs 13 Feb 2003.
Marks assignment: Question 1 = 8 marks, question 2 = 8 marks, question 3 = 10 marks, question 4 = 10 marks, question 5 = 10 marks, question 6 = 8 marks. Total = 54.
1. The picture below shows a thick, low, stratified cloud which is producing precipitation over a broad area.
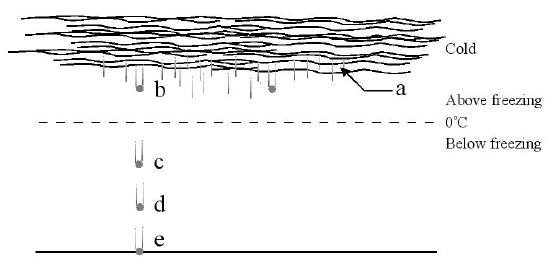
(a) What is the name of this cloud?
(b) At the letter "b" in the diagram, a cold raindrop is falling towards the surface
in above-freezing air. If the raindrop initially formed in the cold upper part of the cloud as
a snowflake, by what process of rain formation was the the precipitation probably formed?
(c) The droplet of water at the point labelled "c" exists in below-freezing
conditions, yet remains a liquid. What special name do we give to the condition of this
particle ? Why does the droplet not instantly freeze?
(d) If the cold droplet freezes at the letter "d" in the diagram, before it reaches the
ground, what will be the name of the precipitation produced?
(e) If, rather than freezing at "d", the droplet does not freeze until it reaches
the ground, what form of precipitation will now result? Briefly describe one recent
event in which this type of precipitation caused catastrophic damage.
2. The cloud shown below is deep, anvil-shaped at the top, and has rain falling from it.
(a) What sort of cloud is it?
(b) What sort of water/ice particles would you be most likely to detect in the regions
denoted by the letters "a" and "b" in the figure?
(c) What sort of particles are most likely to occur in the region "c"?
(d) Suppose a precipitation particle makes several journeys up and down in the region
designated as "c", as shown by the loop of arrows. Write a few sentences describing what the particles would eventually look like
when they finally fall out and reach the ground? What would they be called?
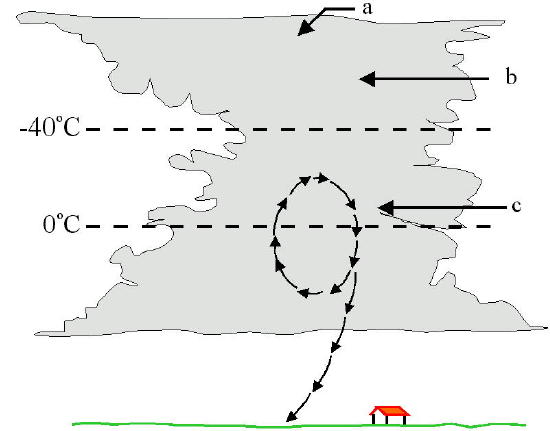
Figure for question 2.
3. The figure below represents summer, daytime (after noon) conditions along the coast of a large body of water in the Northern Hemisphere. Print the figure, and then answer the following questions.
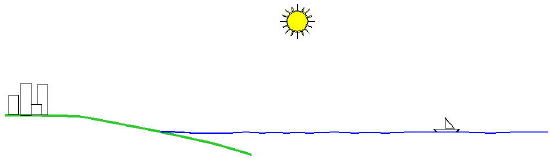
(a) On the diagram, label where the surface air is relatively warm and where it is relatively
cool.
(b) Place a letter "H" on the diagram where the surface air pressure would be relatively
high, and an "L" where the surface air pressure would be relatively low.
(c) Draw several arrows to show the direction of the surface wind.
(d)What is the name of this breeze?
(e) Draw several more arrows to complete the circulation.
(f) Draw a cloud to show where you might expect one to form. Explain why you chose
that location.
4. The figure below shows a surface weather map in the Northern Hemisphere. Numbers on the contours refer to pressures in hPa. Answer the following questions.

(a) What is the sea-level pressure at the point "P"? If the station at "P" at which
these recordings were made was 250 metres above sea-level, what would have been the approximate
actual pressure at the station at the time?
(b) From what direction would the wind most likely be blowing at the point P? (Be sure
to consider both frictional and Coriolis forces in your considerations.) Explain why
you made the choice that you did.
(c) Would the pressure-gradient force at point "P" be directed towards the "H", towards
the "L", towards the point "D" or towards the point "Q"?
(d) Would the wind at point S be most likely to be blowing from the southeast, southwest,
northeast or northwest? Explain.
(e) Would you expect the strongest winds at point "P", "D" or "Q"? Why?
5. The figure below shows an upper level weather map in the Northern Hemisphere. Numbers on the graph represent pressures in hPa. Print the graph and answer the following questions.
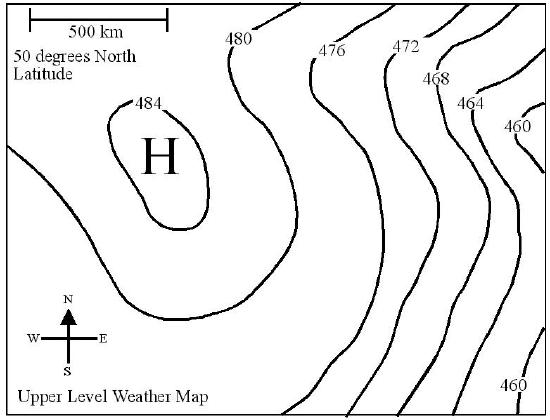
(a) Determine the approximate height at which this map applies.
(b) Draw at least 10 arrows on the chart indicating direction of wind flow
at different points.
(c) Indicate the regions where you would expect the winds to be (i) strongest, (ii)
weakest, and (iii) most easterly.
(d) Determine the strength of the wind at the point where it is strongest. You will
need to make use of the scalings and other information shown on the graph.
[Hint: see the section entitled "A mathematical look at the geostrophic wind", page 226 of the
text book (sixth edition)].
6. Multiple choice questions.
(i) The horse latitudes are the result of:
a) the polar front jet stream(ii) In terms of the three-cell model of the general circulation, areas of surface low pressure should be found near:
a) the equator and 60o latitude(iii) A jet maximum or jet streak is:
a) a contrail that forms behind a jet aircraft(iv) At the equator according to the three-cell general circulation model, we would not expect to find:
a) heavy showers(v) The three-cell model of the general circulation says that in the Northern Hemisphere, you would expect to observe the surface westerlies:
a) southward of the ITCZ(vi) According to the three-cell general circulation model, one would expect the driest regions of the world to be near:
a) latitude 30o and 60o(vii) Which of the following does not occur during a major El Nino event?
a) extensive ocean warming occurs over the tropical Pacific Ocean (viii) An air parcel moving northward from the equator moves closer to the earth's axis of rotation.
Because of the conservation of angular momentum, the parcel's speed should:
------------------- END -------------------------