ASSIGNMENT 1 - Chapters 1-3 .......... Assigned 10 Oct 2002 ........Due date: Friday 25 Oct 2002 by 5 pm.
1. Choose a site in Canada - it could be your home town or a major city. For each day in the one-week period from Oct 7 to Oct 13 (inclusive), read the forecast maximum temperature for the next day and then, on the next day, determine the actual maximum temperature achieved. You could do this with your own thermometer or read the results from the web or from the newspaper. Do the same for the daily minima. Don't forget to indicate the location of your site in your answer!
Compare the forecast and achieved daily maximum and minimum temperatures for this week. eg. You might do a graph or a table - choose your own presentation format. Comment on the accuracy of the forecasts for this period.
[10 points]SOLUTION and COMMENTS.
Due to lack of time because of a heavy teaching load, I have not recorded the temperatures for the allocated period this year. I present the solution for the same project in 2001, when the period covered was Oct. 7 to 14, 2001. Your answer should have been along these lines, but the actual numbers would of course have been different.
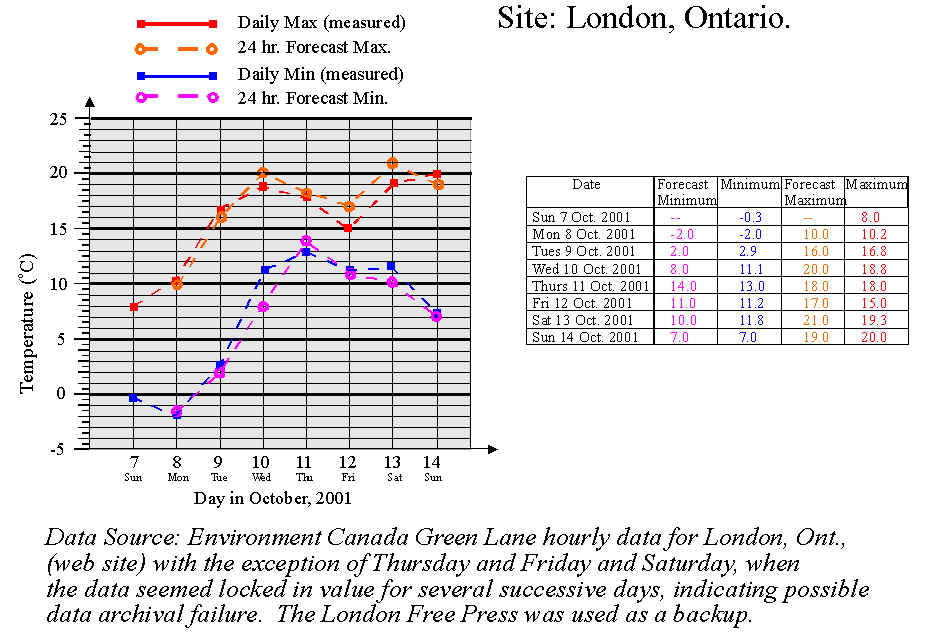
The graph below shows the forecast and actual temperatures in London, Ontario, for the period from Oct 7 to Oct 14, 2001. I did not catch the forecasts for Oct 7. The predictions were taken from the Environment Canada web site, and are approximately 24 hour forecasts, with exceptions as indicated in the diagram. I usually checked the forecasts in the afternoon or early evening, so the forecast minima usually referred to the next morning (and so were generally prepared about 12 hours early), while the maxima usually refer to the following afternoon, and so were approximately 24-hour forecasts.
In general the forecasts make reasonable estimates of the true temperatures, but there is some scatter. Predictions seem to be worst when the weather was changing most dramatically (as you might expect).
I expected some sort of brief discussion as shown above, with a personal impression of the accuracy.
Several students forgot to name their site, resulting in lost marks.
The question specifically asked that you prepare forecasts the DAY BEFORE i.e. use approximately 24 hour forecasts. Marks were deducted for those students who used a 5 or 7-day forecast at the beginning of the week. 5 and 7 day forecasts tend to be somewhat unreliable.
A comment about the accuracies is also in order. I expected you to produce values of the ACTUAL temperatures with reasonable accuracy. However, different sources do not always produce the same result. For example, I compared the measured values reported by Environment Canada to those reported by the London Free Press newspaper. While they generally agreed to within about 1 degree, there were times when the values disagreed by as much as 2 degrees centigrade. This can arise because the values were taken at different sites within London (e.g. downtown and at the airport). It can also occur because the Environment Canada values were taken from hourly averages - it is possible that the actual minimum within that hour, for example, could have been less than the average. A true "mimimum temperature" thermometer wuld record the actual minimum, which may be different to finding the smallest hourly average. Similar comments apply to the maxima. Overall, we can consider the accuracy of these measurements (as representations of the maxima and minima for the whole of the city of London) to be about 1 degree centigrade or so. Local variations within the city could easily be as high as that.
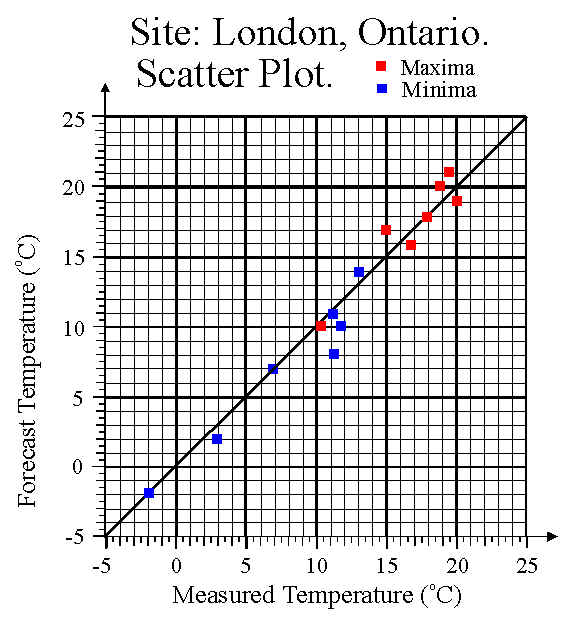
Although you were not expected to do this, another useful way to display the data is as a scatter plot, where we plot the actual temperature on the "x" axis (also called the abscissa) and the predicated temperature for the same event on the "y" axis (ordinate). An example for our data is shown below. If the predictions are perfect, all the points would lie on the line of slope 1 which is shown on the graph. The amount of scatter about this line reflects the error in the predictions.
2. By using the "links" on the "world-wide-web" physics103.com site (or otherwise), download at least TWO successive precipitation maps produced using radar, and print them (or, for those WWW students using electronic submission, store them to file and embed them in your answer). You may choose any of the radars - the one at Exeter might be easiest to access since I have set up a direct link for it, but you can choose another one if you like. Ensure that the map was a period when there was at least some precipitation activity. Briefly describe the passage of any interesting precipitation bands which were tracked by the radar (direction of movement, duration etc.)
[6 points]SOLUTION and COMMENTS.
Again, I present my results from 2001, to illustrate the idea.
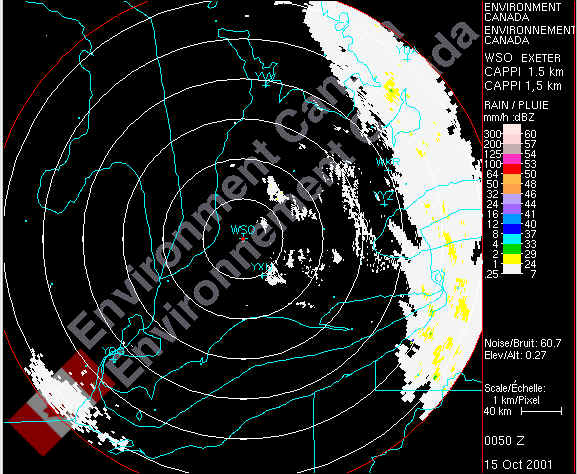
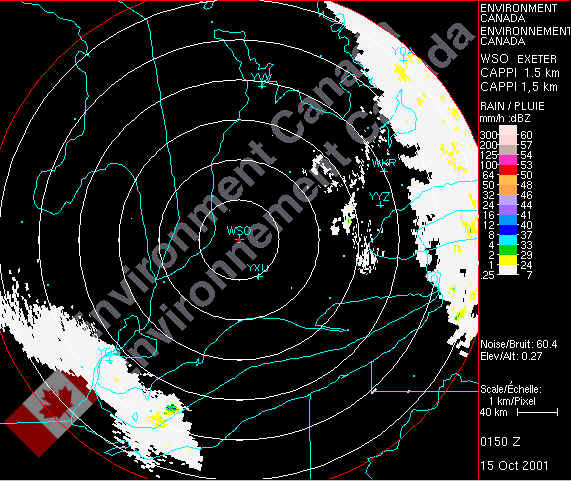
My two maps are shown below, for the times of 0050 and 0150 UT on 15 Oct 2001. There are clearly two rain bands moving to the northeast (from the south-west). In the period prior to this time, the precipitation had been much more extensive in scope and it had been raining over London for some time.
Comments.
I gave full marks provided you gave me two maps like the above ones, and had a brief discussion along the lines of the one I have given above. Several students misinterpreted
the mean of "successive", and thought I meant to take records on two separate days, whereas I meant
in two successive hours.
3. Answer the following multiple choice questions (you may use the text book to find the answer if you like).
(i) The primary source of oxygen for the earth’s atmosphere during the past half-billion years or so appears to be:
a) volcanic eruptionsAnswer: (c) Photosynthesis.
(ii) Which gas below is not considered to be a greenhouse gas.
a) carbon dioxide (CO2)Answer: (b) Oxygen.
(iii) The proper order of wavelengths from the longest to the shortest is
a) visible, infrared, ultravioletAnswer: (b) Infrared, visible, ultraviolet.
(iv) If the earth had no atmospheric greenhouse effect, the average surface temperature would be
a) lower than at presentAnswer: (a) lower than at present
(v) The "Greenhouse Effect" explains warming in
a) the atmosphere and in a gardener's greenhouseAnswer: (b) the atmosphere, but not in a greenhouse.
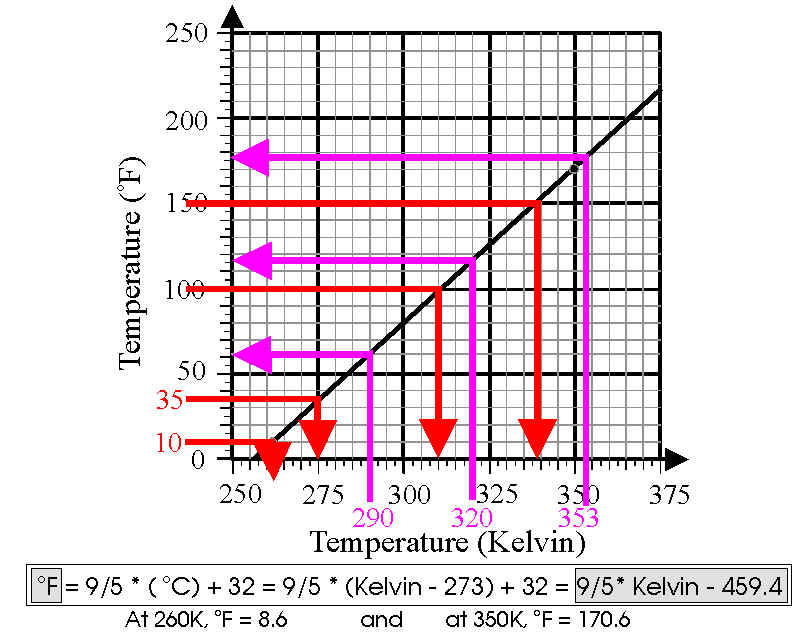
4. Using the two formulae on page 27 of the text book,
draw a graph which enables you to convert a measurement in
degrees Fahrenheit to a measurement in Kelvin (K).
(Hint: do the calculation for two points and draw a straight line
between them.)
Use your graph to write down the temperatures in Kelvin when the
temperature is
(i) 10 degrees Fahrenheit, (ii), 35 degrees Fahrenheit, (iii) 100 degrees
Fahrenheit, and (iv) 150 degrees Fahrenheit.
Also use the graph to convert the following temperatures (in K) to
degrees Fahrenheit:
(v) 290 K, (vi) 320 K, and (vii) 353 K.
SOLUTION and COMMENTS.
Conversions:
(I am giving the numbers to integer precision, but I will only expect answers to about 2 degrees accuracy. I am not specifying greater accuracy because the formula for converting between Centigrade and Kelvin given in the text book is not quite right - the number to add in the second equation on page 27 should in fact be 273.15, not 273.0. However, I have used 273 to be consistent with the book, but will not user higher precision than integer values.)
The conversions can also be read directly from the graph, and I have indicated these with the red and purple arrows (red follows the conversions from Fahrenheit to Kelvin, and the purple arrows show the conversions from Kelvin to Fahrenheit).
(i) 10 degrees Fahrenheit = 261 Kelvin
(ii) 35 degrees Fahrenheit = 275 Kelvin
(iii) 100 degrees Fahrenheit = 311 Kelvin
(iv) 150 degrees Fahrenheit = 339 Kelvin
(v) 290 Kelvin = 63 degrees Fahrenheit
(vi) 320 Kelvin = 117 degrees Fahrenheit
(vii) 353 Kelvin = 176 degrees Fahrenheit
5. (a) What is the current temperature of the sun's surface?
(b) At what wavelength does it radiate most power?
(c) If the temperature of the sun increased by 10%:
(i) how much would its output power increase by?
(ii) what would be the new wavelength at which most
power is emitted?
SOLUTION and COMMENTS.
(a) The current temperature at the Sun's surface is 6000 Kelvin (see your text book, page 34).
(b) Using the equation which tells us that the wavelength at which the highest radiation intensity is emitted is equal to 2897 divided by the temperature in Kelvin (text book, page 34), we can work out that this wavelength is equal to 0.483 micrometres (483 nanometres or 4,830 Angstroms).
(c) The radiated power is proportional to the temperature to the fourth power. If the temperature is increased by 10%, it increases to 1.1 times its current value. Thus the output power would increase to 1.1 to the fourth power times its current value. i.e. the new power output would be 1.464 times the old value, or an increase of 46.4%. With regard to specific numbers, the current radiated power from the Sun is equal to (sigma)*T4, or 7.35 x 10⁷ Watts per square metre, and the additional radiated power will be 46% of this, or 3.41 x 10⁷ Watts per square metre.
(d) The new temperature will be 1.1 times 6000, or 6600K. Thus the new wavelength at which the highest power density is emitted will be 2897/6600 = .439 micrometres.
6. In your own words, describe why rising air cools and falling air warms (less than 250 words).
SOLUTION and COMMENTS.
The key point which must appear in your answer to this question is the fact that the atmospheric density and pressure decrease (exponentially) as the altitude increases. Consequently, when a parcel of air is displaced upward, its internal pressure will exceed that of it surroundings, and it will expand in size. This expansion ensures that the parcel density will be diminished, and therefore its pressure will be less too. It will continue to do this until its own internal pressure matches that of the surrounding air. But for the parcel to expand in size requires energy. If you imagine the walls of the air parcel expanding, you can imagine that air molecules which bounce off this "wall" will be reflected with diminshed velocity, thus slowing in speed. Hence the energy for expansion is taken from the kinetic energy of the molecules themselves, since we assume that there are no external sources of energy (i.e. we assume an adiabatic process). Such a loss in kinetic energy is equivalent to a temperature decrease. Conversely, if the parcel of air is forced downwards, it moves into a region of higher surrounding pressure, and is therefore compressed (resulting in a larger internal pressure). The molecules within the parcel gain energy as they reflect off the incoming "wall", thus allowing the molecules to attain increased speed. The temperature of the parcel therefore increases.
7. Explain why, on a normal summer's day, the daily temperature maximizes around 2:00 - 5:00 p.m. and not at 12 noon (less than 250 words).
SOLUTION and COMMENTS.
The important thing to recognize in answering this question is that the period of maximum heat input does not necessarily correspond to the time of maximum temperature. Rather, maximum nett heat input (i.e. at noon) corresponds to a period when the temperature is increasing most rapidly. We will first examine the ground temperature. After noon, the heat input decreases, but it is still positive, and so if there were no losses then the ground temperature would still continue to increase, albiet more slowly than at noon. Thus if there was no way for the heat to leave the ground and the air, the temperature would continue to increase even until the evening, and it would in fact be hottest at sunset! But of course heat does get lost from the ground, both by radiation and by air transport (conduction, convection, advection). Heat losses are generally greatest when the temperature is greatest, so we expect losses to be smallest in the morning. This is true because of two effects - first, the air is cooler because the sun has only just risen (and radiative losses are less when the temperature is cooler), and second, because the heating that does occur in the morning tends to only heat the lowest few centimetres of the atmosphere, since on a still day the primary heating is by conduction, and the air is a poor conductor. Only as the temperature warms later in the morning and towards noon does convection set in, causing a greater mixing of air and allowing the air several metres and more above the ground to heat more rapidly. Since the radiation losses are proportional to the temperature to the fourth power, the radiation losses in the morning will be considerably less than in the afternoon. Hence in the morning, and up until noon, the temperature will climb fairly smoothly, and this will continue well beyond noon. However, as the ground heats up, and convection sets in (thereby heating the atmosphere and allowing more radiation), losses will become more significant, and some time after noon the temperature will be hot enough that losses via radiation start to exceed the heating input from the sun. At this time, the ground and air will start to cool, and will continue to do so as long as the heat input from the sun is less than the radiation and conduction losses. (Radiation and other loss processes also continue past sunset, and throughout the night, until the next sunrise and beyond.) As a result, the ground will maximize in temperature well after noon.Additional Comments
The above dicscussion gives a guide to the sorts of things I wanted to see in your answers. But I wanted to elaborate a little on these points here, since I sense that they are still not fully understood. I am going to concentrate on the temperature of the ground; the air is heated via the ground, so if we can show that the heating of the ground suffers a delay, it must follow that the heating of the air must also suffer an equivalent or greater delay.
I want to begin with the following diagram.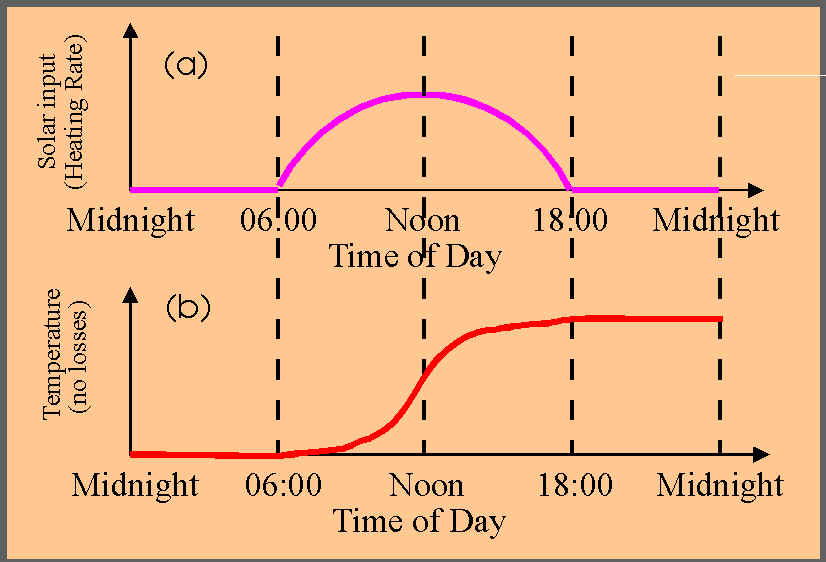
The upper graph shows the heating input from the sun. It maximizes around noon. The second graph shows what would happen to the temperature if the ground absorbed energy but never lost any. The ground would just get hotter and hotter, even after noon. You can see from the graph that the temperature increase most rapidly near noon, and then climbs less steeply, but it does continue to climb. Finally, at sunset there is no more heat input, so the temperature stays fixed.
If indeed the ground never lost any energy, the temperature would stay at this temperature all night, and then when the sun rose the next day, the temperatre would continue to climb even further! After several days the ground would be at a temperature of thousands of degrees Celsius.
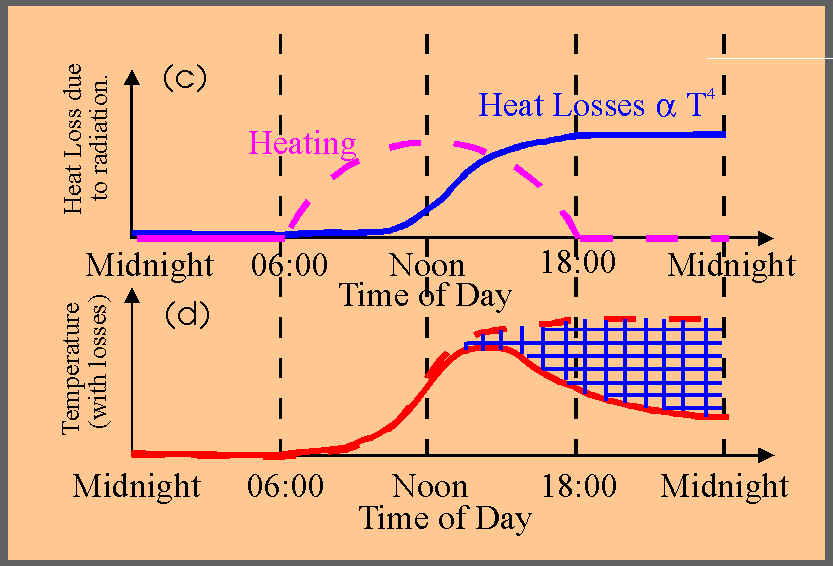
Now we need to consider the loss mechanisms. These include radiation, and loss to the surrounding air. Whichever we consider, it is approximately true that losses are greatest when the ground temperature is highest. Radiation losses are proportional to the fourth power of T. Diffusive and conduction losses depend on the temperature gradient at the ground. Thus the rate of loss of heat is described by the blue curve in fig (c) below. Losses are greatest in the afternoon. I have added the heat INPUT as the broken purple line just for a reference. You can see that the losses are greater well after noon.
Thus the rate of temperature increase is slowed by these losses, but as long as the heat input from the sun exceeds these losses, the temperature will continue to rise (but at a slower pace). Eventually, as the sun's input diminishes, and the temperature continues to climb, the losses will exceed the heat input, and the ground will finally begin to cool.
Fig. (d) below shows this effect. The broken red line shows the temperature variation if there were no heat losses (copied from fig. (b)), but now we realize that losses become important as the afternoon proceeds. The blue hatching indicates the effect of nett heat losses, which drags the temperature profile down from the broken to the solid red line. Hence we see that the temperature falls in the late afternoon.
Of course since the temperature falls, the radiation is also diminished, so we have a feedback loop in which the temperature affects the amount of radiation, which in turn affects the temperature, which in turn affects the amount of radiation loss. But the principle remains the same - namely that in the afternoon the radiated energy becomes more significant than in the morning, thereby lowering the temperature as the afternoon progresses.
As a point of interest, physicists and mathematicians would examine this problem by setting it up as a mathematical equation, which would look like the following:
dT/dt = c.Q - a. T4
which just says that the RATE OF CHANGE OF TEMPERATURE equals a constant multiplied by the heat input minus another constant multiplied by the temperature to the fourth power. The constants depend on things like the specific heat of the ground and the Stefan-Boltzmann constant. One could also complicate the equation further by adding in diffusion and conduction terms, which would depend on the temperature gradient between the ground and the air.