Surface Features and Magnetic Activity
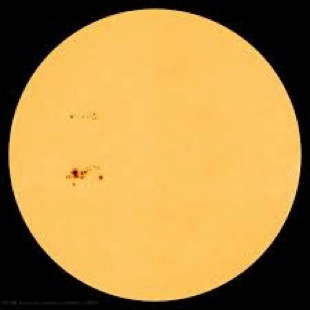
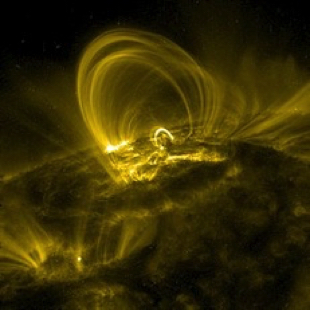
There are several types of features that can be non-uniform over a stellar surface. Consider the Sun. It has complex spots where loops of twisted magnetic field poke out through the surface, inhibit the local convective outflow of energy, and reduce the temperature in the spot, making it look darker than the surrounding photosphere. Sunspots cover only a small portion of the solar surface and even large ones diminish the total light by less than 1%. It turns out that some other stars have much bigger spots. Another big difference is that individual sunspots rarely make it through a full solar rotation of a little less than a month, while the larger stellar spots often stay around for years. The magnetic field coming out of the spots often rises high above the photosphere, forms a big loop, and comes down through a partner sunspot, i.e., spots typically come in pairs. Energetic particles get caught in such loops and produce a very inhomogeneous outer atmosphere like the coronal loops shown below on the right. The cores of the Ca II H & K lines in the near ultraviolet show emission that varies with the non-uniform atmospheric structure. Because the H & K lines are so strong, their cores are formed above the photosphere in the chromosphere.
The numbers of sunspots wax and wane with an 11-year cadence, and the strength of the cycle is quite variable. Lots of other things on the Sun change over this 11-year solar cycle, including the chromospheric and coronal strength, flare numbers, polarity and strength of the general magnetic field, and the power output. The disappearance of spots between about 1650 and 1710 is called the Maunder Minimum and corresponded to a long cold period on earth. See the article Historical Evidence for the Existence of the Solar Cycle by John A. Eddy in the book The Solar Output and Its Variations, (Colorado University Press: Boulder), O.R. White, ed., p. 51.
Most stellar spots are found on cool stars that are rotating more rapidly than ‘normal’ because they are binaries with tidal coupling. The classic example, using rotational mapping, can be seen in Vogt & Penrod 1983 PASP 95, 565. Additional material and background on starspots and rotational mapping can be found in Photospheres and Lectures.
The G8 V dwarf star, ξ Boo A, has an interesting surface feature, which Cliff Toner and I dubbed a ‘patch,’ that was detected through periodic variation in line bisectors. You can read about it in 1988 ApJ 334, 1020. The star rotates with a period of 6.43 ± 0.01 days. The patch is at a latitude ~ 55º, is ~ 200 ºK cooler than the rest of the surface, covers ~ 10% of the visible disk, and has double strength velocity fields.
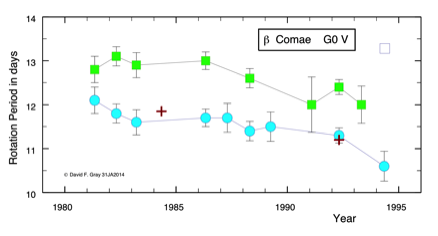
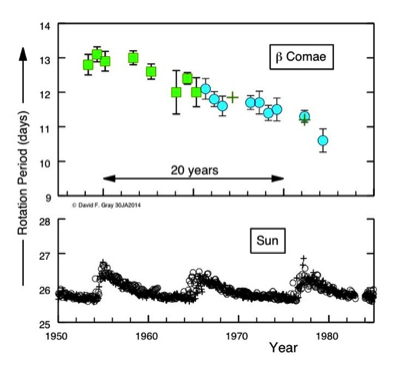
A star more similar to the Sun, being just ~ 150 ºK hotter, is β Comae. It has spots that seem to maintain the same longitude, but change their latitude systematically over a few years. A Fourier analysis of the line broadening indicates a projected rotation rate of v sin i = 4.10 ± 0.06 km/s. Periodogram analysis of the HK emission (proxy for magnetic regions) shows two rotation periods in the 11 to 13 day range like this:
Two spots (green and blue points) show periods that change with time. This is interpreted as spots migrating in latitude coupled with different rotation rates at different latitudes. From Gray & Baliunas 1997 ApJ 475, 303.
Now it turns out that the Sun also shows a variation in period of its magnetic regions. In a broad general sense, there is the well-known ‘butterfly diagram’ that shows sunspot latitudes as a function of time:
This figure is from the NASA Marshall Space Flight Center site. The butterfly diagram shows how sunspots on any given 11-year cycle first form at ~ ±30º, while spots that form later in the cycle are closer to the equator. But latitudes closer to the solar equator are rotating faster (or with shorter periods), so there is a systematic shift in apparent rotation period of the magnetic regions, the sunspots, through each 11-year cycle.
The results for β Com can be interpreted in a similar manner. Assuming the two spots on the star represent different latitudes, there changes can be put together to give a greater latitude span like this:
The observed range of period for β Com is several times larger than for the Sun (bottom graph; circles for northern hemisphere, crosses for southern) and the time to go through a cycle is at least twice as long. The solar data was graciously provided by J. Lean of the Naval Research Laboratory. One might speculate that the spots on β Com are larger and longer lived because the star’s rotation rate is twice as fast as the Sun’s.
Magnetic activity is common for stars on the cool side of the Granulation Boundary. Older stars often show cyclic behavior with their activity, as the Sun does with its 10-11 year cycle. Younger stars usually show more chaotic behavior. A few per cent of cool dwarfs show little or no magnetic activity.
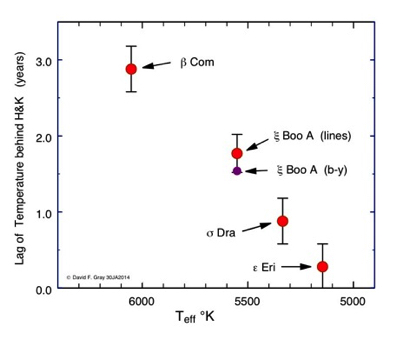
One can search for changes in the three signatures of granulation, small changes in temperature using line-depth ratios and color indices, variations in H & K emission, and photometric changes. Interesting and unexplained observation of phase lags among these parameters occur. The lag of temperature variations behind H & K variations can amount to several years and depends on the effective temperature of the star, as shown by this figure:
The temperatures are monitors using line-depth ratios, and also a b-y color index, in the case of ξ Boo A. How or if the Sun fits into this picture is not clear.